
Investing in the stock market can be a rewarding journey, but it’s crucial to have the right tools and knowledge at your disposal. One of the essential skills for any successful investor is the ability to read and analyze stock charts. Stock charts provide valuable insights into a company’s performance and can help you make informed investment decisions. In this article, we will take a deep dive into the world of stock charts and provide you with a comprehensive guide on how to read and analyze them effectively in the context of the USA stock market.
Understanding Stock Charts
Stock charts, also known as price charts, are graphical representations of a stock’s historical price movements over a specified time period. They are composed of various data points, including the stock’s opening price, closing price, high price, and low price for each trading day or time interval. By analyzing these charts, investors can identify trends, patterns, and potential opportunities or risks.
Types of Stock Charts
There are several types of stock charts, but the three most commonly used are:
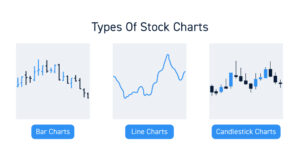
Bar Charts
Bar charts display a stock’s price movements using vertical bars. Each bar represents a trading day or time period and includes the high, low, opening, and closing prices. Bar charts provide more detailed information than line charts.
Line Charts
Line charts connect the closing prices of a stock over time, creating a simple visual representation of its price trend. They are useful for identifying long-term trends.
Candlestick Charts
Candlestick charts offer a visual representation of a stock’s price movements that includes not only the open, high, low, and close prices but also show the relationship between opening and closing prices. They are excellent for spotting market sentiment shifts.
Time Frames
Stock charts can be displayed in various time frames, such as daily, weekly, monthly, or intraday (e.g., hourly or minute-by-minute). The choice of time frame depends on your investment horizon. Short-term traders may prefer intraday charts, while long-term investors may focus on weekly or monthly charts.
Reading Stock Charts
Now that we’ve covered the basics, let’s delve into how to read and analyze stock charts effectively.
Identify Trends
The primary goal of chart analysis is to identify trends. Trends can be classified as:
Uptrend: When a stock’s price is consistently making higher highs and higher lows.
Downtrend: When a stock’s price is consistently making lower highs and lower lows.
Sideways (Range-bound): When a stock’s price moves within a relatively narrow price range.
Recognizing the current trend is essential for making informed decisions.
Support and Resistance Levels
Support levels are price levels at which a stock tends to find buying interest, preventing it from falling further. Resistance levels are price levels at which a stock tends to face selling pressure, preventing it from rising higher. Identifying these levels can help you make strategic entry and exit decisions.
Volume Analysis
Volume is a critical component of stock chart analysis. It shows the number of shares traded during a specific time period. A surge in volume often accompanies significant price movements, indicating the strength of a trend or a potential reversal.
Patterns and Indicators
Chart Patterns:
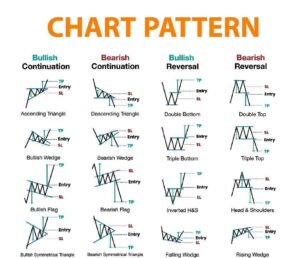
- Head and Shoulders Pattern: This pattern typically signals a trend reversal from bullish to bearish. It consists of three peaks – a higher peak (head) between two lower peaks (shoulders) on the chart. When the price breaks below the neckline connecting the lows of the two shoulders, it suggests a potential downtrend.
- Double Tops and Bottoms: These are reversal patterns. A double top is formed after an uptrend and suggests a potential trend reversal to the downside. Conversely, a double bottom forms after a downtrend and signals a potential trend reversal to the upside.
- Flag Patterns: Flag patterns are continuation patterns that appear as a brief consolidation (flag) within a strong trend. A bullish flag occurs in an uptrend and suggests that the price may continue to rise after the consolidation. A bearish flag occurs in a downtrend and suggests a potential further decline.
Understanding these patterns can help investors identify key turning points in the market and make informed decisions about entering or exiting trades.
Technical Indicators:
- Moving Averages: Moving averages are trend-following indicators that smooth out price data over a specific period. The most common types are simple moving averages (SMA) and exponential moving averages (EMA). Crossovers of short-term and long-term moving averages can signal potential buy or sell opportunities.
- Relative Strength Index (RSI): RSI is a momentum oscillator that measures the speed and change of price movements. It ranges from 0 to 100 and helps traders identify overbought (above 70) and oversold (below 30) conditions. An RSI above 70 might suggest that a stock is overbought and due for a correction, while an RSI below 30 could indicate an oversold condition and a potential rebound.
- Moving Average Convergence Divergence (MACD): MACD is a versatile indicator that combines moving averages with divergence analysis. It consists of two lines, the MACD line and the signal line. A MACD crossover above the signal line is considered a bullish signal, while a crossover below is bearish. Additionally, MACD histogram bars represent the difference between the MACD and signal lines, offering further insight into momentum.
Utilizing these technical indicators in conjunction with chart patterns allows investors to confirm trends and identify potential reversals more effectively.
Candlestick Patterns
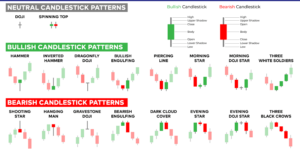
Candlestick patterns provide a detailed view of price action and market sentiment. Learning to interpret these patterns can greatly enhance your ability to make well-timed investment decisions:
- Doji: A doji occurs when the opening and closing prices are virtually the same. It signals market indecision and potential reversal. A bullish doji following a downtrend can indicate a potential upswing, while a bearish doji after an uptrend may signal a downturn.
- Hammer: A hammer is a bullish reversal pattern characterized by a small body at the top of the candlestick and a long lower shadow. It suggests that sellers tried to push the price lower, but buyers stepped in, leading to a potential trend reversal.
- Engulfing Patterns: These patterns consist of two candlesticks and signal strong reversals. A bullish engulfing pattern occurs when a small bearish candle is followed by a larger bullish candle, indicating a shift from bearish to bullish sentiment. Conversely, a bearish engulfing pattern suggests a shift from bullish to bearish sentiment.
Incorporating candlestick patterns into your chart analysis can help you identify critical turning points and improve the timing of your trades, making them a valuable tool for traders and investors alike.
By mastering these chart patterns, technical indicators, and candlestick patterns, you’ll gain a deeper understanding of market dynamics and be better equipped to make informed decisions in the USA stock market. However, always remember to use these tools in conjunction with other forms of analysis and risk management strategies to maximize your chances of success.
Conclusion
Reading and analyzing stock charts is an essential skill for any investor looking to navigate the USA stock market successfully. By understanding the different types of charts, time frames, and key elements like trends, support and resistance levels, volume, patterns, and indicators, you can make more informed investment decisions. However, remember that chart analysis is just one tool in your investment toolbox. Combining it with fundamental analysis and a well-defined investment strategy will enhance your chances of success in the dynamic world of stock market investing. Keep learning, stay informed, and always be cautious with your investments.


