
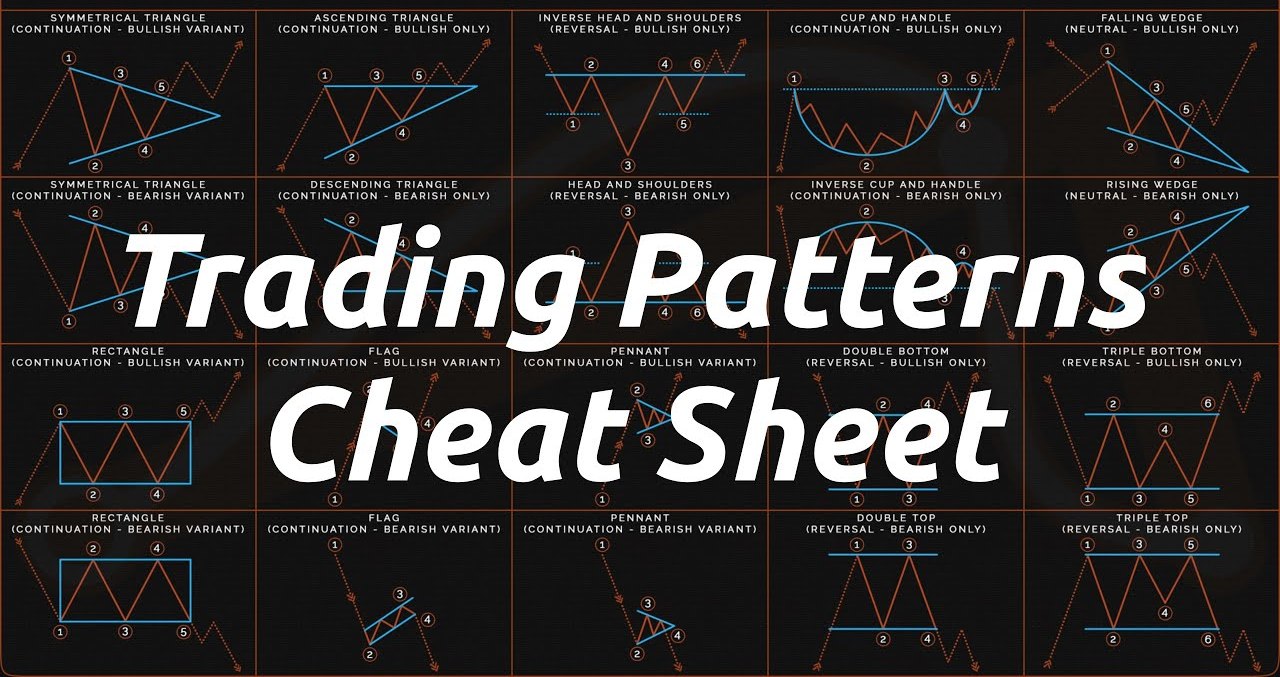
Technical analysis relies on deciphering the language of price movements through chart patterns. These patterns, formed by the price action over time, offer hints about potential future trends. Here’s a comprehensive breakdown of 11 common chart patterns, including entry points, stop-loss placements, and target levels:
Continuation Patterns
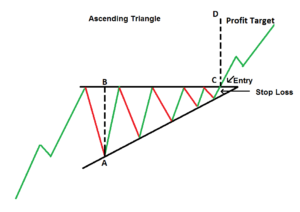
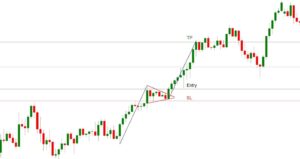
Ascending Triangle (Bullish)
This triangle resembles an upward channel, with price action bouncing between a rising trendline (support) and a horizontal line (resistance). A breakout above resistance suggests a continuation of the uptrend.
- Entry: Above the resistance line with confirmation from bullish volume.
- Stop-Loss: Below the support trendline.
- Target: Measured move projection – project the height of the triangle from the breakout point upwards.
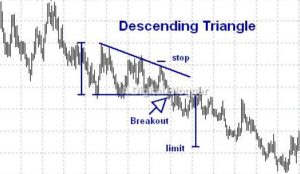
Descending Triangle (Bearish)
Opposite of the ascending triangle, this pattern slopes downwards, with price bouncing between a falling trendline (resistance) and a horizontal line (support). A confirmed breakout below support indicates a continuation of the downtrend.
- Entry: Below the support line with confirmation from bearish volume.
- Stop-Loss: Above the resistance trendline.
- Target: Measured move projection – project the height of the triangle from the breakout point downwards.
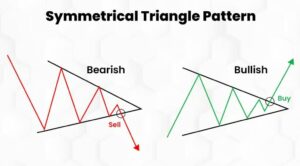
Symmetrical Triangle (Neutral)
This triangle has converging trendlines (both support and resistance) that meet at a point. It doesn’t predict direction, but a breakout above resistance suggests an upside move, while a breakdown below support indicates a downside move.
- Entry: After a confirmed breakout above resistance or below support, with additional confirmation from volume.
- Stop-Loss: Below the support trendline for a breakout above resistance, or above the resistance trendline for a breakdown below support.
- Target: Measured move projection similar to ascending and descending triangles.
Pennant Chart Pattern (Bullish or Bearish)
Formed during a consolidation phase within an existing trend, pennants are shaped like flags with converging trendlines. A breakout above resistance in an uptrend or below support in a downtrend signals a continuation of the trend.
- Entry: Similar to symmetrical triangles, after a confirmed breakout with volume.
- Stop-Loss: Below the support trendline for a bullish pennant or above the resistance trendline for a bearish pennant.
- Target: Measure the height of the pennant’s “flagpole” (the price movement leading into the pennant) and project it from the breakout point.
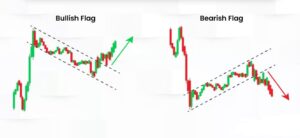
Flag (Bullish or Bearish)
Similar to pennants, flags have parallel trendlines but tend to be shorter in duration. They also indicate a continuation of the prevailing trend after a breakout.
- Entry: Similar to pennants.
- Stop-Loss: Similar to pennants.
- Target: Similar to pennants, measure the height of the “flagpole” and project from the breakout point.
Reversal Patterns
Head and Shoulders (Top)
This bearish reversal pattern resembles a head with two shoulders. The “head” is the highest peak, with the shoulders being lower on either side. A confirmed breakdown occurs when the price closes below the “neckline,” a line drawn connecting the lows of the shoulders.
- Entry: Short sell below the neckline with confirmation from bearish volume.
- Stop-Loss: Above the neckline.
- Target: Measured move projection – project the distance from the head to the neckline down from the breakdown point.
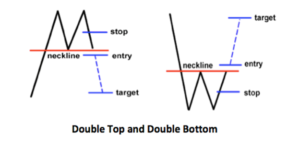
Double Top/Bottom
These patterns consist of two consecutive peaks (double top) or troughs (double bottom) at roughly the same price level. A confirmed reversal to the downside (for a double top) happens when the price closes below the support level, the line connecting the lows between the two peaks. Conversely, a breakout above the resistance level (line connecting the highs) for a double bottom signals a potential reversal upwards.
- Entry: Long for a double bottom after a confirmed breakout above resistance with bullish volume; Short for a double top after a confirmed breakdown below support with bearish volume.
- Stop-Loss: Below the double bottom’s low for longs; Above the double top’s high for shorts.
- Target: Measured move projection similar to ascending and descending triangles.
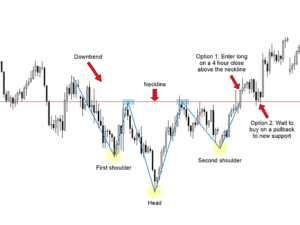
Inverse Head and Shoulders (Bottom)
The bullish counterpart of the head and shoulders pattern, this pattern is flipped upside down. It consists of a low “head” with two higher shoulders on either side. A confirmed breakout occurs when the price closes above the neckline, a line drawn connecting the highs of the shoulders.
- Entry: Long after a confirmed breakout above the neckline with bullish volume.
- Stop-Loss: Below the neckline.
- Target: Measured move projection – project the distance from the head to the neckline up from the breakout point.
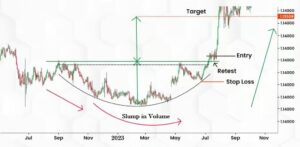
Rounding Bottom (Bullish)
This U-shaped pattern resembles a bowl and indicates a potential trend reversal from downtrend to uptrend. The lower the price dips in the “bowl,” the stronger the potential reversal signal.
- Entry: Long after a confirmed breakout above the resistance level (formed by the top of the bowl) with bullish volume.
- Stop-Loss: Below the lowest point of the bowl.
- Target: Measured move projection similar to ascending and descending triangles.
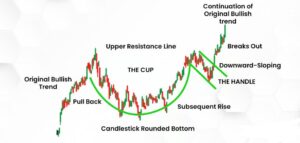
Cup and Handle (Bullish)
This pattern resembles a cup with a handle. The “cup” is formed by a U-shaped price movement, and the “handle” is a short, downward price movement following the cup. A breakout above the rim of the cup is considered a buy signal.
- Entry: Long after a confirmed breakout above the rim with bullish volume.
- Stop-Loss: Below the lowest point of the cup.
- Target: Measured move projection – project the height of the cup from the breakout point upwards.
Bilateral Patterns
Ascending/Descending Wedge (Neutral)
These wedge patterns are formed by converging trendlines (either rising or falling) that squeeze price action. They don’t predict direction, but a breakout above resistance in a rising wedge suggests potential upside, while a breakdown below support in a falling wedge suggests potential downside.
- Entry: After a confirmed breakout with additional confirmation from volume.
- Stop-Loss: Below the support trendline for a breakout above resistance in a rising wedge, or above the resistance trendline for a breakdown below support in a falling wedge.
- Target: Not as clear-cut for wedges due to their neutral nature. However, some traders use measured move projections similar to other patterns.
Remember:
- These are general guidelines, and market conditions can always affect how a pattern plays out.
- Always conduct your own research and consider other technical indicators alongside chart patterns before making a trade.
- Proper risk management, including stop-loss orders, is crucial for protecting your capital.
By understanding these chart patterns and how to interpret them, you can gain valuable insights into potential price movements and make more informed trading decisions. However, remember that chart patterns are just a tool, and successful trading requires a comprehensive approach that considers various factors.
Related Articles
Market Sentiment: Definition, Indicators and Example
Understanding Option Trading: For Beginners


